
How to Build an Operational Report That Drives Decisions
Design readable, reusable reports that answer the right question instead of displaying more data.
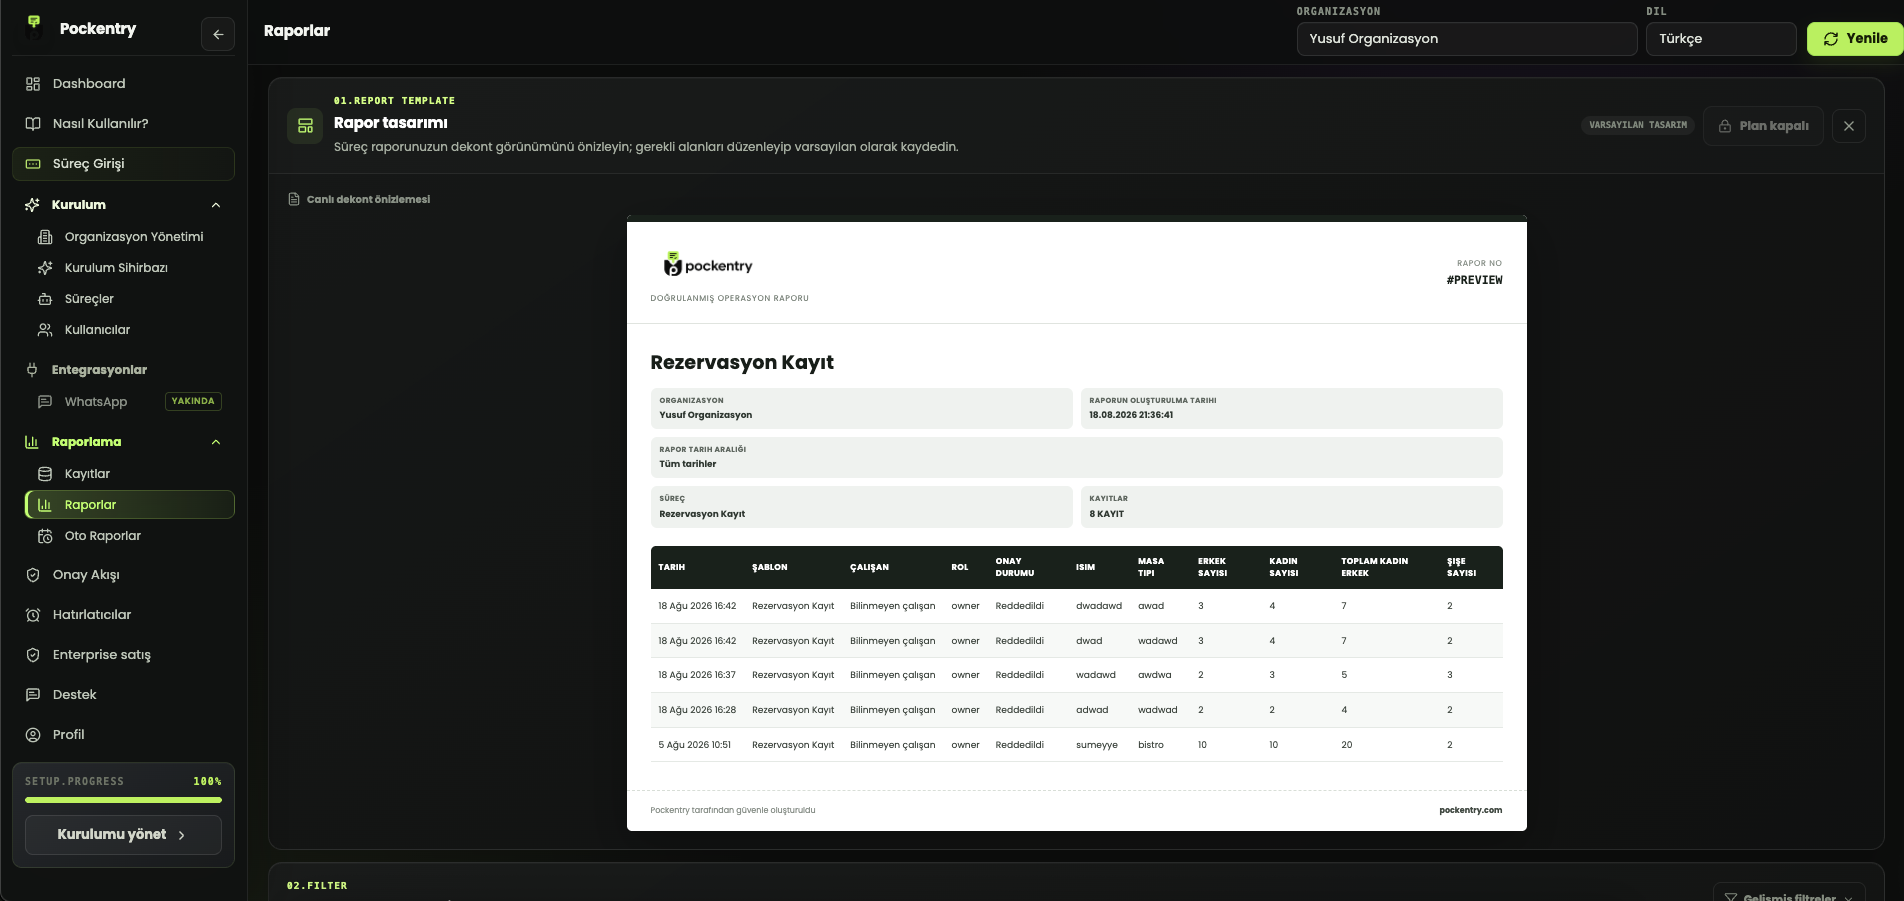
The value of a report is measured by how easily it supports the next decision, not by its row count. Putting every field into one table may look detailed while hiding the change, delay or exception that matters.
Define the reader and the decision
A branch manager may need daily gaps, an operations lead weekly trends, and finance only approved amounts. Different reports from the same records are normal. Begin with the decision the reader must make afterward.
Separate summary from detail
Start with totals, state distribution and exceptions that need attention. Put the detailed record table after the summary. A manager can understand the situation in seconds and inspect the source when needed.
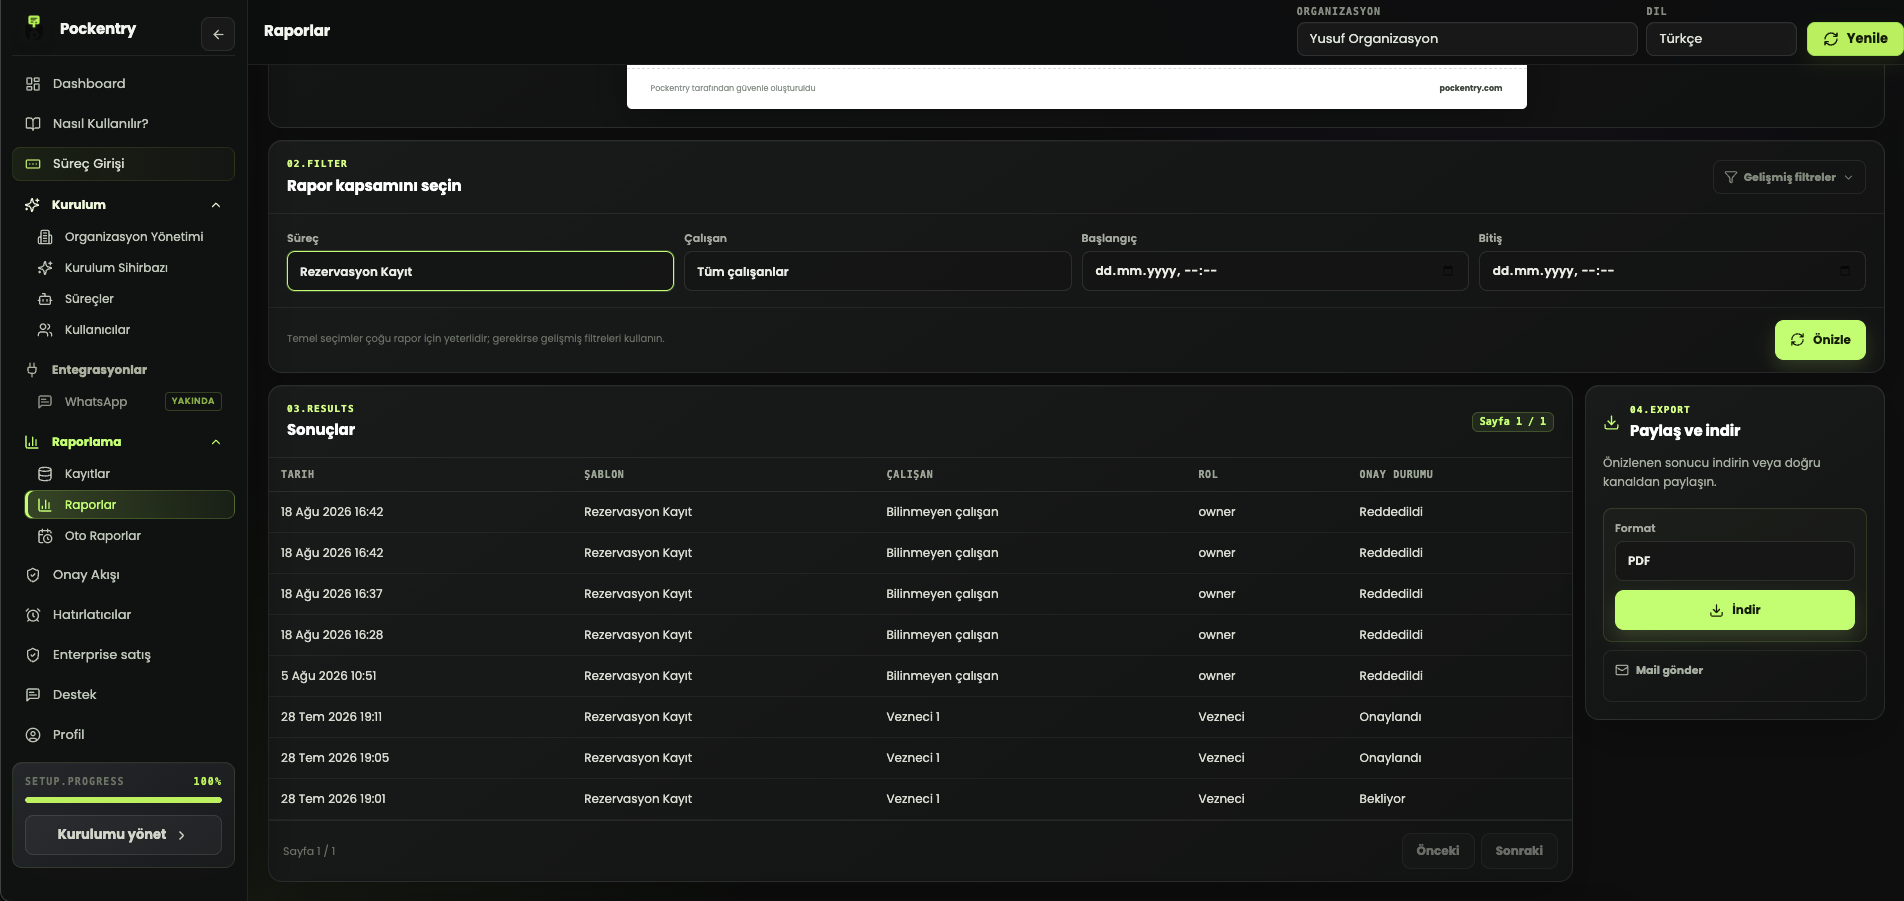
Limit filters to the report purpose
- Period: today, week, month or custom range
- Scope: workflow, location, team or owner
- State: pending, approved, rejected or complete
- Exception: late, incomplete or outside threshold
If the same report is prepared manually every week, save the design and schedule it. Consistent reporting is not just automatic delivery; it applies the same filters and calculations every period.
PDF and Excel serve different needs
PDF suits a management summary whose layout must be preserved. Excel is useful for detailed review, additional calculations or transfer to another system. Pockentry lets you design report fields and export the same records in either format.