
How Should an Operations Calendar and Analytics Work Together?
Manage upcoming work with a calendar, reveal recurring bottlenecks with charts, and turn daily records into a measurable control system.
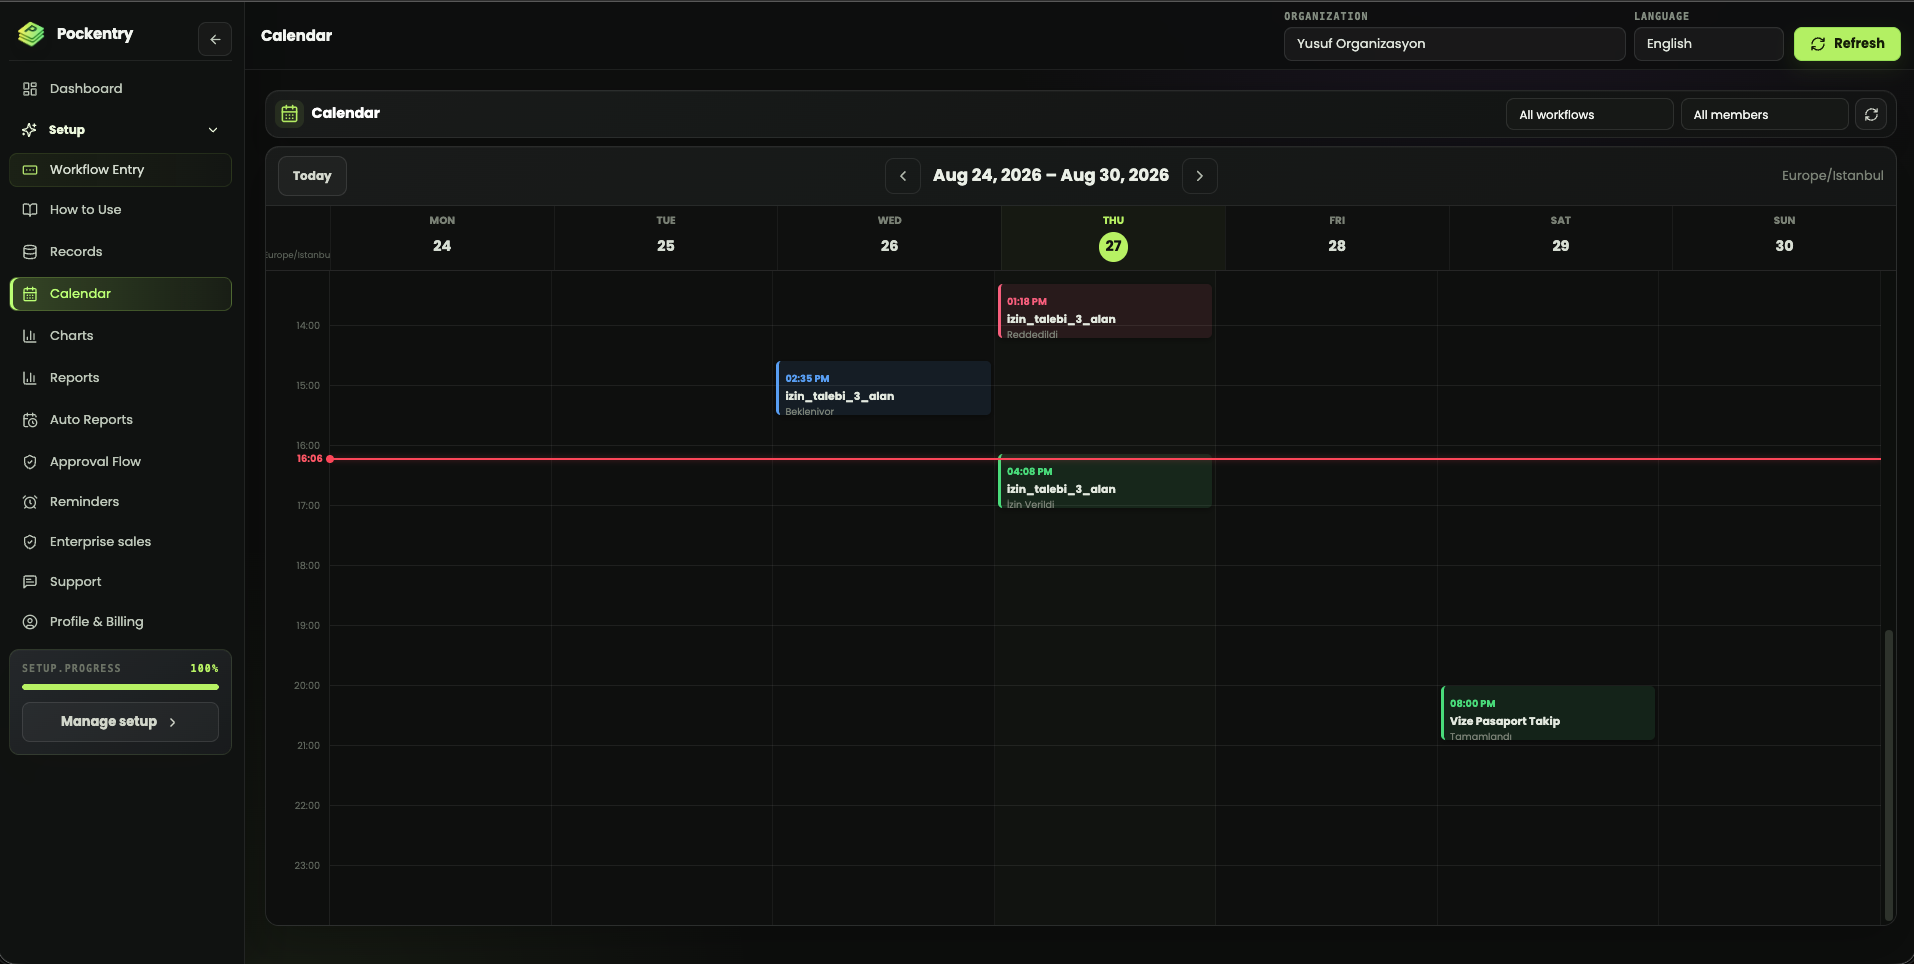
Calendars and charts ask two different questions of the same data. A calendar answers “what happens next?” while analytics reveals “what keeps happening over time?” Used together, they help a team coordinate upcoming work and evaluate capacity or process problems without relying on guesswork.
Make the calendar more than an appointment list
Bring workflow fields such as delivery date, field visit, leave start, or maintenance time into a shared calendar. Each event should preserve its workflow, team member, and work status so the team sees context and the next action, not only a time slot.
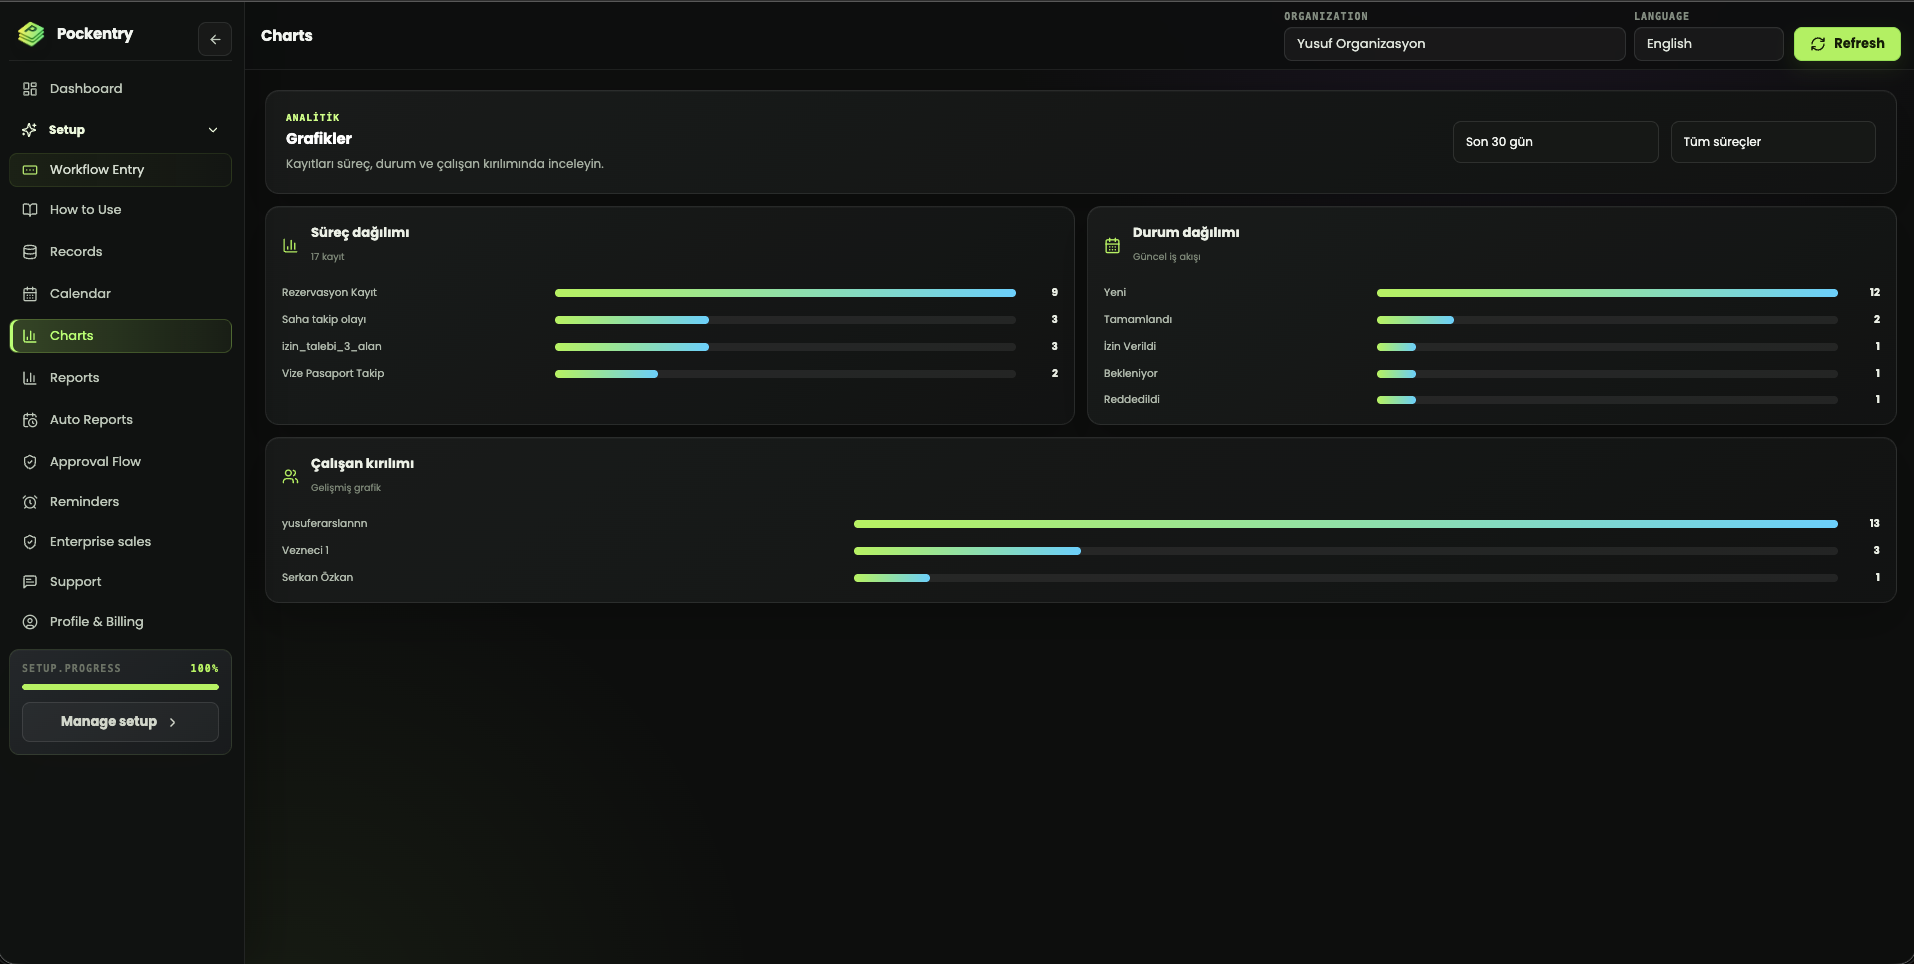
Look at distribution first, then investigate the cause
- Which workflow creates the most records?
- Where do records accumulate by status?
- Is workload balanced across team members?
- Does the selected period contain an unusual rise or drop?
- Are overdue calendar items concentrated in one workflow?
A high record count is not automatically good or bad. Volume in completed work may indicate capacity, while volume in pending states may reveal a bottleneck. Use workflow, status, member, and date filters together before drawing a conclusion.
Build a weekly control rhythm
At the start of the week, review upcoming work and owners on the calendar. At the end, compare completion distribution, pending states, and team workload in charts. Pockentry connects daily coordination with management analysis by presenting the same workflow records through calendar and advanced analytics views.